Microsoft's Impressive Free Cash Flow - MSFT Stock Could Be Worth 28% More
/Microsoft%20Corporation%20logo%20on%20sign-by%20Jean-Luc%20Ichard%20via%20iStock.jpg)
Microsoft Corp. (MSFT) generated impressive free cash flow (FCF) growth and higher FCF margins in the June quarter, and said capital expenditure (capex) growth would moderate. That could lead to a +28% upside in MSFT's price over $668 per share. This article will show why.
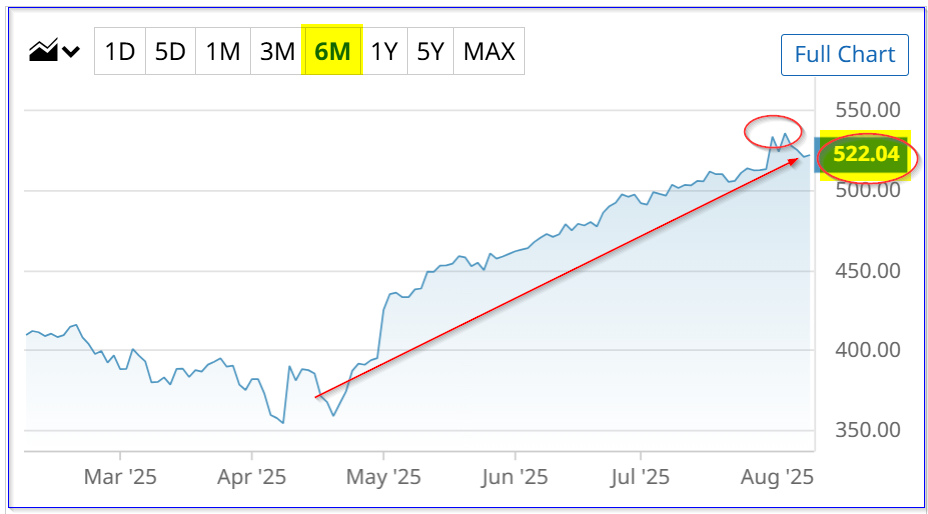
MSFT closed at $522.04 on Friday, Aug. 8, 2025, which was lower than the pre-release high of $535.64 on Aug. 4. In a prior Barchart article ("Analysts Keep Raising Microsoft Stock Price Targets - Time to Buy?), I had set a price target of $618 based on its FCF margins.
After Microsoft's fiscal Q4 earnings for the June 30 quarter and management's outlook and guidance for the next fiscal year, I am raising this target to over $668 per share.
That is a 15% higher price target, based on Microsoft's stellar operating cash flow (OCF) margins and its lower growth in its capex. That will lead to significantly higher free cash flow (FCF) and FCF margins next year. Let's look at this.
Higher Operating Cash Flow Margins and Lower Capex Growth Will Propel FCF Higher
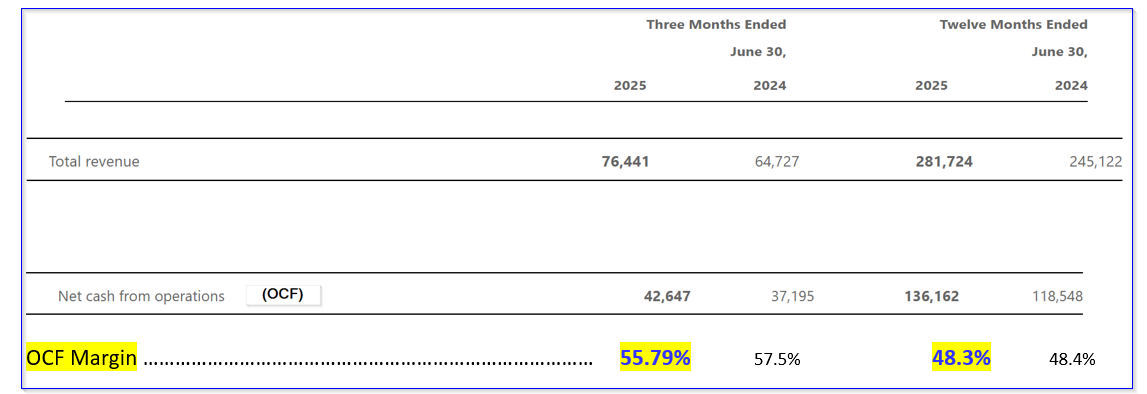
Microsoft's operating cash flow (OCF) for the June quarter (fiscal Q4) was $42.647 billion, +14.7% higher than the prior year. However, the OCF margin was significantly higher than the past 2 quarters, implying that it has squeezed out more cash from its operations.
For example, the fiscal Q4 ratio of OCF to revenue was 55.79% (i.e., $42.647 billion/$76.44 billion), compared to 52.8% in fiscal Q3 ending March 31 (i.e., $37.044 b/$70.066 b), and in Q2 it was 32%. For the full year, Microsoft generated $136.16 billion in OCF on $281.7 billion in revenue, or 48.3% of revenue, on par with 48.4% in the prior year.
As a result, if Microsoft keeps generating high operating cash flow margins with higher revenue, and if capex growth moderates, its FCF could rise significantly.
Revenue Forecast. Here is why I think this will happen. First, management projects that revenue growth will be in “double digits.”
That is seen on page 6 of its outlook deck. Last year, sales were up 14.9% and in Q4, +18% Y/Y. Moreover, analysts are now projecting almost 15% growth next year.
For example, 54 analysts surveyed by Seeking Alpha have FY 2026 revenue at $322.04 billion (+14.3%) and the same forecast at Yahoo! Finance.
OCF Forecast. Therefore, let's assume that Microsoft will generate at least 53% OCF margins next year (lower than the 55.79% margin in Q4, but higher than the 48.3% OCF margin in FY 2025):
$322.04 billion revenue x 53% OCF margin = $170.68 billion operating cash flow (OCF)
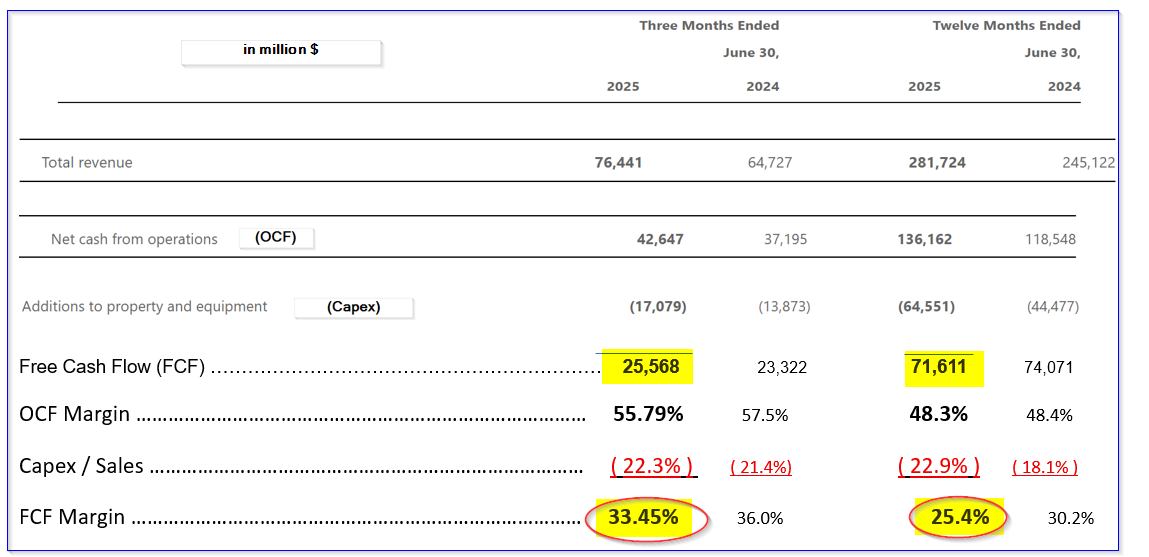
Capex Forecast. In the outlook deck, management indicated that it expects that FY 2026 capital expenditure growth will moderate. That has already started. In fiscal Q4, capex rose just 2.0% from the prior quarter to $17.079 billion from $16.745 billion in fiscal Q3. That compares with the full-year 45% growth in capex from $44.48 billion to $64.55 billion in FY 2025.
As a result, let's assume capex rises +10% in FY 2026, slightly faster than the annualized 8.0% Q4 2025 growth rate (2.0% x 4). That puts the full year FY 26 capex at $71.00 billion.
Free Cash Flow Forecast (FCF): Free cash flow is OCF minus capex. Here is how that works out for FY 2026:
$170.68b OCF FY 2026 est. - $71.0 billion capex est. = $99.68 billion FCF
That works out to be $28 billion higher than the $71.611 billion generated in FY 2025 (see table below), i.e., a 39% year-over-year increase for FY 2026.
Moreover, it represents a significantly higher FCF margin for next year:
$99.68 FCF FY 2026 est. / $322.04 billion FY 2026 revenue est. = 31.0% FCF Margin
Last year, Microsoft's FCF margin was 25.4% (i.e., $71.6b/$281.7 billion - see table above).
As a result, given this higher FCF forecast, the market will likely give MSFT stock a higher valuation over the next 12 months. Let's look at that.
MSFT Price Target
One way to value a stock like this is to use a FCF yield metric. For example, Yahoo! Finance says the market cap on Friday was $3.88 trillion (i.e., $3,880 billion).
Therefore, its FY 2025 FCF of $71.6 billion represents 1.845% of that market value. That is the same as a multiple of 54x (i.e., $3,880b/$71.6b = 54.19).
Just to be conservative, let's use a lower multiple of 50x, i.e., a 2.0% FCF yield:
$99.68b FCF est / 0.02 = $4,984 billion target
In other words, given our assumptions, Microsoft's value could rise over $1 trillion over the next 12 months, or an upside of +28.5%:
$4,984 / $3,800 b mkt cap today = 1.2845 -1 =+28.5% upside
Let's lower that to 28%. As a result, our price target is $668.21 per share:
$522.04 p/sh today x 1.28 = $668.21 target price
Summary of the Valuation
Here is a summary of what that means. If analysts' +14.3% revenue forecast comes to pass, and if Microsoft generates a 53% operating cash flow margin with 10% higher capex growth, its FCF will rise to almost $100 billion.
That will represent an annual FCF margin of 31%, vs. 25.4% last year. As a result, using a 2.0% FCF yield metric, MSFT stock could be worth over 28% more.
One way to play this is to set a lower buy-in target price and get paid while waiting. This can be done by selling short out-of-the-money (OTM) puts in nearby expiry periods.
Shorting OTM puts
For example, I discussed this play in my last Barchart article, where I suggested shorting the $470 put strike price for expiry on Aug. 8.
The investor made an immediate yield of almost 1.5% (i.e., $6.80/$470.00 = 0.01447 = 1.447%) for 38 days until expiry at a strike price that was over 4.3% below the trading price (i.e., out-of-the-money). That option expired worthless, and the investor had no obligation to buy shares at $470.00.
This play can now be repeated. For example, look at the Sept. 12 expiry period. It shows that the $505.00 strike price, over 3% below the trading price, has a midpoint premium of $5.18.
That represents about a 1% short-put yield for the next month (i.e., $5.18/$505.00 = 0.010257 = 1.026%).
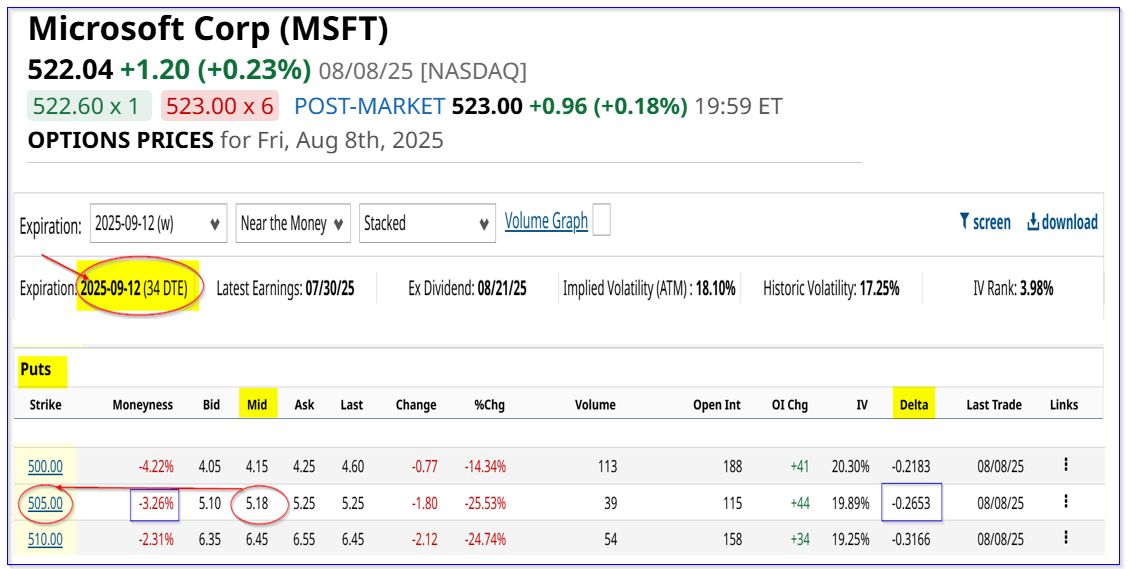
This means that an investor who secures $50,500 in cash and/or buying power with their brokerage can earn an immediate income of $518.00 in their account. As long as MSFT stays over $505.00 in the next 34 days, the price of the put will degrade (i.e., time decay).
As a result, the investor may end up having the $50.5K collateral assigned to buy 100 shares (i.e., $50,500 = 100x $505.00).
The bottom line is that this is a good way to set a lower potential buy-in point. For example, the breakeven investment price would be below $500:
$505.00 strike - $5.18 income received = $499.82 breakeven
That is 4.26% below today's price, so this provides good downside protection. As a result, if MSFT rises to the target price of $668.21, the investor has a potential upside of 33.7%.
(Investors can study Barchart's Options Learn Center Tutorials and various options webinars to study the risks associated with options investing.)
The bottom line is Microsoft stock looks deeply undervalued here. Investors can set a lower potential buy-in by shorting OTM puts in nearby expiry periods to play it.
On the date of publication, Mark R. Hake, CFA did not have (either directly or indirectly) positions in any of the securities mentioned in this article. All information and data in this article is solely for informational purposes. For more information please view the Barchart Disclosure Policy here.