Option Volatility And Earnings Report For Aug 11 - 15

There is a big lull in earnings reports this week before some bigger names start to report again the week after.
This week, we just have Cisco Systems (CSCO), Applied Materials (AMAT), Sea Ltd (SE), Petroleo Brasileiro (PBR), Nu Holdings (NU), Coreweave (CRWV) and Jd.com (JD) reporting.
Before a company reports earnings, implied volatility is usually high because the market is unsure about the outcome of the report. Speculators and hedgers create huge demand for the company’s options which increases the implied volatility, and therefore, the price of options.
After the earnings announcement, implied volatility usually drops back down to normal levels.
Let’s take a look at the expected range for these stocks. To calculate the expected range, look up the option chain and add together the price of the at-the-money put option and the at-the-money call option. Use the first expiry date after the earnings date. While this approach is not as accurate as a detailed calculation, it does serve as a reasonably accurate estimate.
Monday
Nothing of note
Tuesday
SE – 11.3%
CRWV – 18.4%
Wednesday
CSCO – 5.3%
Thursday
AMAT – 6.0%
PBR – 4.0%
NU – 8.6%
JD – 6.2%
Friday
Nothing of note
Option traders can use these expected moves to structure trades. Bearish traders can look at selling bear call spreads outside the expected range.
Bullish traders can sell bull put spreads outside the expected range, or look at naked puts for those with a higher risk tolerance.
Neutral traders can look at iron condors. When trading iron condors over earnings, it is best to keep the short strikes outside the expected range.
When trading options over earnings, it is best to stick to risk defined strategies and keep position size small. If the stock makes a larger than expected move and the trade suffers a full loss, it should not have more than a 1-3% effect on your portfolio.
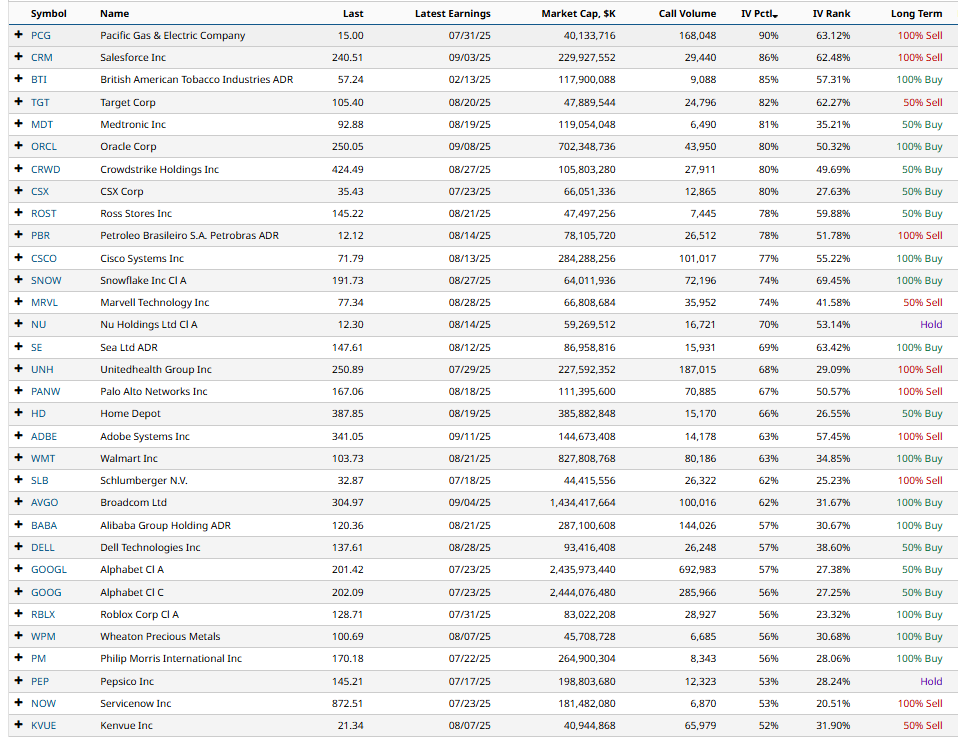
Stocks With High Implied Volatility
We can use Barchart’s Stock Screener to find other stocks with high implied volatility.
Let’s run the stock screener with the following filters:
- Total call volume: Greater than 5,000
- Market Cap: Greater than 40 billion
- IV Percentile: Greater than 50%
This screener produces the following results sorted by IV Percentile.
You can refer to this article for details of how to find option trades for this earnings season.
Last Week’s Earnings Moves
PLTR +7.9% vs 12.1% expected
WMB -2.1% vs 4.2% expected
AMD -6.4% vs 8.9% expected
PFE +5.2% vs 4.2% expected
ANET +17.5% vs 9.5% expected
BP +3.4% vs 3.9% expected
CAT +0.1% vs 5.2% expected
APP +12.0% vs 16.6% expected
UBER -0.2% vs 7.8% expected
DIS -2.7% vs 6.3% expected
SHOP +22.0% vs 11.6% expected
OXY +2.5% vs 4.9% expected
ABNB -8.0% vs 7.9% expected
MCD +3.0% vs 3.6% expected
FTNT -22.0% vs 9.2% expected
DASH +5.0% vs 9.9% expected
LLY -14.1% vs -6.7% expected
XYZ -4.5% vs 10.6% expected
TTD -38.6% vs 13.3% expected
DDOG -0.4% vs 8.7% expected
Overall, there were 13 out of 20 that stayed within the expected range. 10 out of 20 moved higher following their announcement.
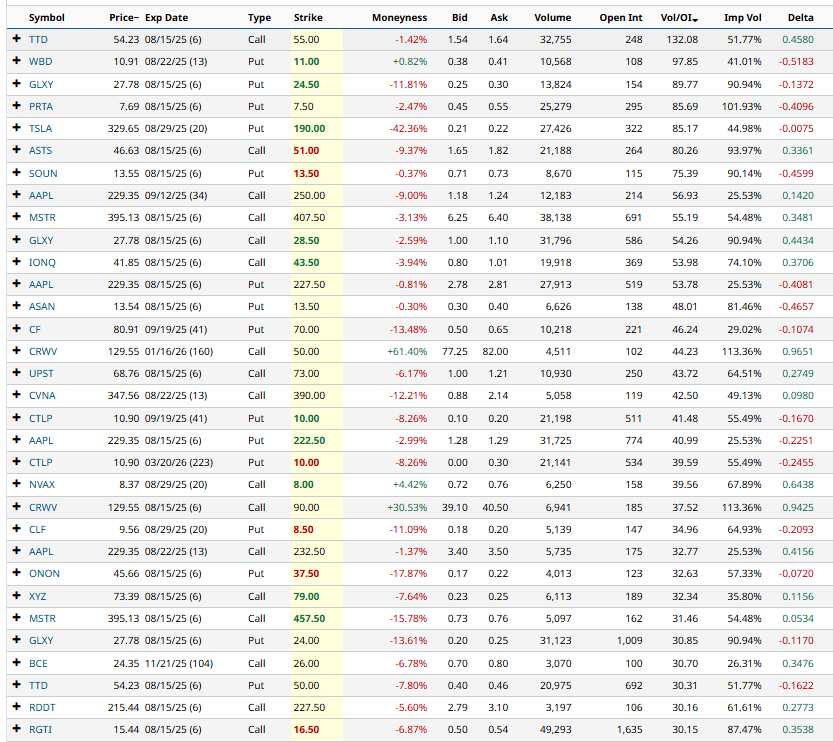
Unusual Options Activity
TTD, WBD, TSLA, AAPL, MSTR, CRWV, CVNA and UPST and all experienced unusual options activity last week.
Other stocks with unusual options activity are shown below:
Please remember that options are risky, and investors can lose 100% of their investment. This article is for education purposes only and not a trade recommendation. Remember to always do your own due diligence and consult your financial advisor before making any investment decisions.
On the date of publication, Gavin McMaster did not have (either directly or indirectly) positions in any of the securities mentioned in this article. All information and data in this article is solely for informational purposes. For more information please view the Barchart Disclosure Policy here.